VCG INSIGHTS · THEMES · NO. 2
By Bhavik Khatri, Founder & Managing Principal
Banks Didn’t Leave. They Moved Down the Stack.
Banks now sit in two places in commercial real estate: on the senior loans they want, and behind many of the lenders that take the rest.
For most of this cycle, the line in our business was that banks walked away from commercial real estate and private credit walked in. That was true in 2023. Today it hides more than it explains.
Bank capital is still in the market, but more of it reaches commercial real estate through other lenders instead of going straight to owners. That changes who sets the price of credit, how fast that price moves, and where the real gaps are.
What’s changing
The banks that came back to direct lending went after the loans banks always want: stabilized buildings, real cash flow, modest leverage. On some multifamily deals this year, they priced below Fannie and Freddie. The structure showing up across the market is a bank senior loan under 60% of value, with a debt fund behind it in mezzanine debt or preferred equity.
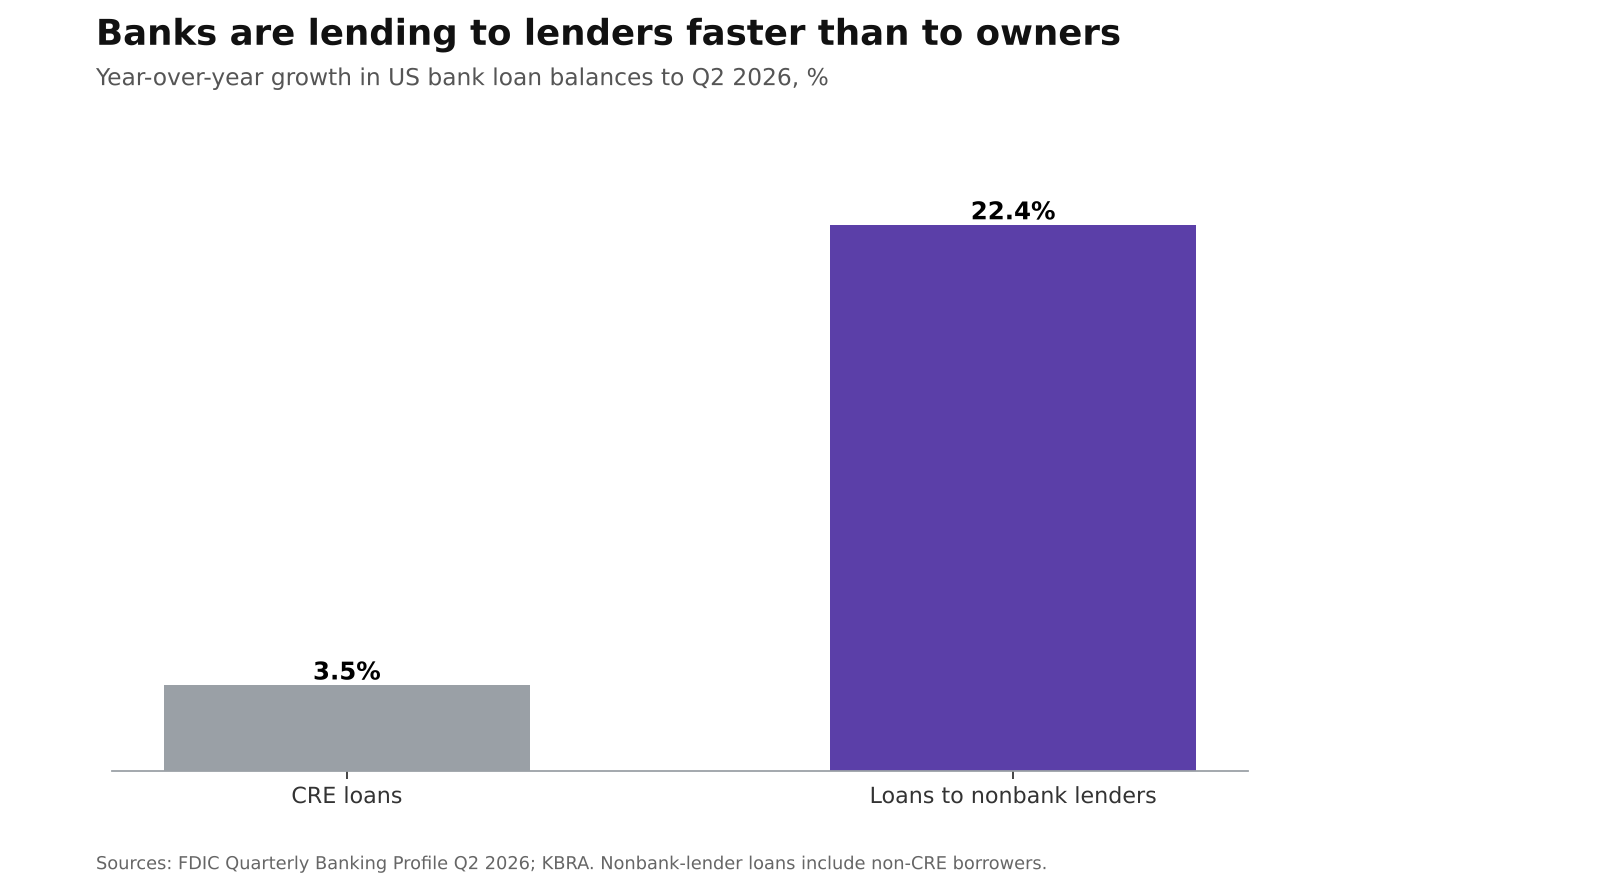
Meanwhile, bank lending to other lenders has grown much faster than bank lending to owners. In the year to June, US banks grew their loans on commercial property by 4.1%. Their loans to nonbank lenders grew 22.4%, or $279 billion, the largest dollar increase of any loan category the FDIC reports. Not all of that reaches real estate, but the direction is clear. The FDIC also notes that bank lending to nonbank financial firms has been the fastest-growing loan segment since the financial crisis.
There’s no clean public number for how much of that is real estate. The closest regulatory line, loans to mortgage credit intermediaries, also includes residential lenders. So read the 22.4% as direction, not size.
!Banks are lending to lenders faster than to owners
Why it’s changing
The economics point one way. Hold a transitional loan directly and the bank carries all of the risk, from the first dollar of loss to the last. Lend to a fund against a pool of those loans and it sits senior, diversified and protected by the fund’s equity, still earning a spread on real estate. The fund takes the first loss and does the work. If I were running a bank’s balance sheet, I’d make the same trade.
The lender behind the lender
This is the part most borrowers never see. A debt fund usually isn’t lending only its own money. It puts in some equity and borrows the rest from a bank on a warehouse line, a credit line secured by the fund’s loans. The line usually renews once a year. The fund’s loans often run three years or more.
So a fund’s quote carries two views: the fund’s view of your deal, and the bank’s view of the fund. When the bank lowers its advance rate or adds to its spread at renewal, the fund must quote wider or accept a lower return. Nothing about the building has changed.
In this example, a ten-point cut in the advance rate plus 25 bps on the line forces the fund about 75 bps wider. Bank lines reprice faster than fund loans do. Tighter credit reaches fund quotes well before it shows up in any market-share table.
Connecting the capital
Increasingly, the price of transitional credit gets set in a bank renewal meeting the borrower isn’t invited to.
Debt-fund appetite is more cyclical than it looks, because it rides on lines that reset every year. The banks that lend to both sponsors and funds see the same deal from two sides, and in effect set the cost of competing with themselves.
The gaps depend on which bank you mean. Money-center and large regional banks now reach construction and smaller loans mostly through the funds they finance. Community banks still lend there directly, within their size and concentration limits. What falls between them, such as commodity office or a construction loan too large for a community bank and too small for a fund, is where I think the gap is structural. I don’t think lower rates close it.
%%coda%%
In practice
This shows up in three kinds of conversations. One is about the financing behind lenders: how warehouse, repo and back-leverage terms are moving, and what that does to what a fund can charge. Another is about pairing a bank senior loan with fund mezz or pref to reach leverage neither offers alone. The third is about the loans that fall between the two, too large for a community bank and too small for most funds, and what kind of capital ends up filling that gap.
%%close%%
We'll keep testing this against the data in the Briefing.
Sources and methodology
- Sourcing note: we cite the organization that produced each figure. Where its own release isn’t publicly accessible, we name the outlet we read it in.
- Bank lending: FDIC, Quarterly Banking Profile, Second Quarter 2026.
- Loans to nondepository financial institutions rose $279.1B (22.4%) year over year. This category is broader than CRE lending.
- Nonfarm nonresidential (commercial property) loans rose 4.1%, from Table II-A.
- Fastest-growing segment: FDIC, Bank Lending to Nondepository Financial Institutions (Feb 2026), covering 2010–2024.
- Bank pricing below the agencies: CBRE multifamily placement data, as reported by CRE Daily (2026). CBRE’s underlying data is not public.
- Senior/junior structures: Moody’s Ratings, as reported by CRE Daily (2026). The Moody’s report is subscription-only.
- Warehouse example: illustrative assumptions, not market data. Spread earned on equity = (loan spread − advance rate × bank spread) ÷ (1 − advance rate). Ignores fees, hedging and credit losses.
- Capital treatment: “Why it’s changing” describes risk position (seniority and first-loss protection), not regulatory capital. Risk weights on direct CRE loans and on loans to nonbank lenders can be similar. We make no claim that one carries a lower capital charge.
- CRE share of nonbank lending: not publicly isolated. Banks over $10B report a subcategory for mortgage credit intermediaries in call reports; it includes residential as well as commercial lenders.
- Dated evidence: CBRE quarterly lender shares and the Q4 2026 spread test appear in the October Briefing.