VCG INSIGHTS · THEMES · NO. 1
By Bhavik Khatri, Founder & Managing Principal
The Next Owners Will Buy the Debt First
In this cycle, a large share of commercial real estate is changing hands through its loans, without ever being listed for sale.
Ask around the industry when this market will turn and you’ll hear the same answer: when buildings start trading again. Sellers give up, buyers come back, prices clear. It’s a reasonable answer, but I think it looks in the wrong place.
This time, a lot of ownership is moving through the loan. The borrower hands over the keys or the lender sells the paper, and the building has a new owner without ever coming to market. Anyone who tracks only property sales will miss a large part of how ownership is changing.
The waiting ended
For three years, almost everyone agreed to wait. Lenders extended, borrowers paid what they could, and both sides hoped rates would come down before anyone had to book a loss. The plan depended on lower rates. They didn’t arrive on that schedule, and in 2026 lenders began resolving loans instead of extending them.
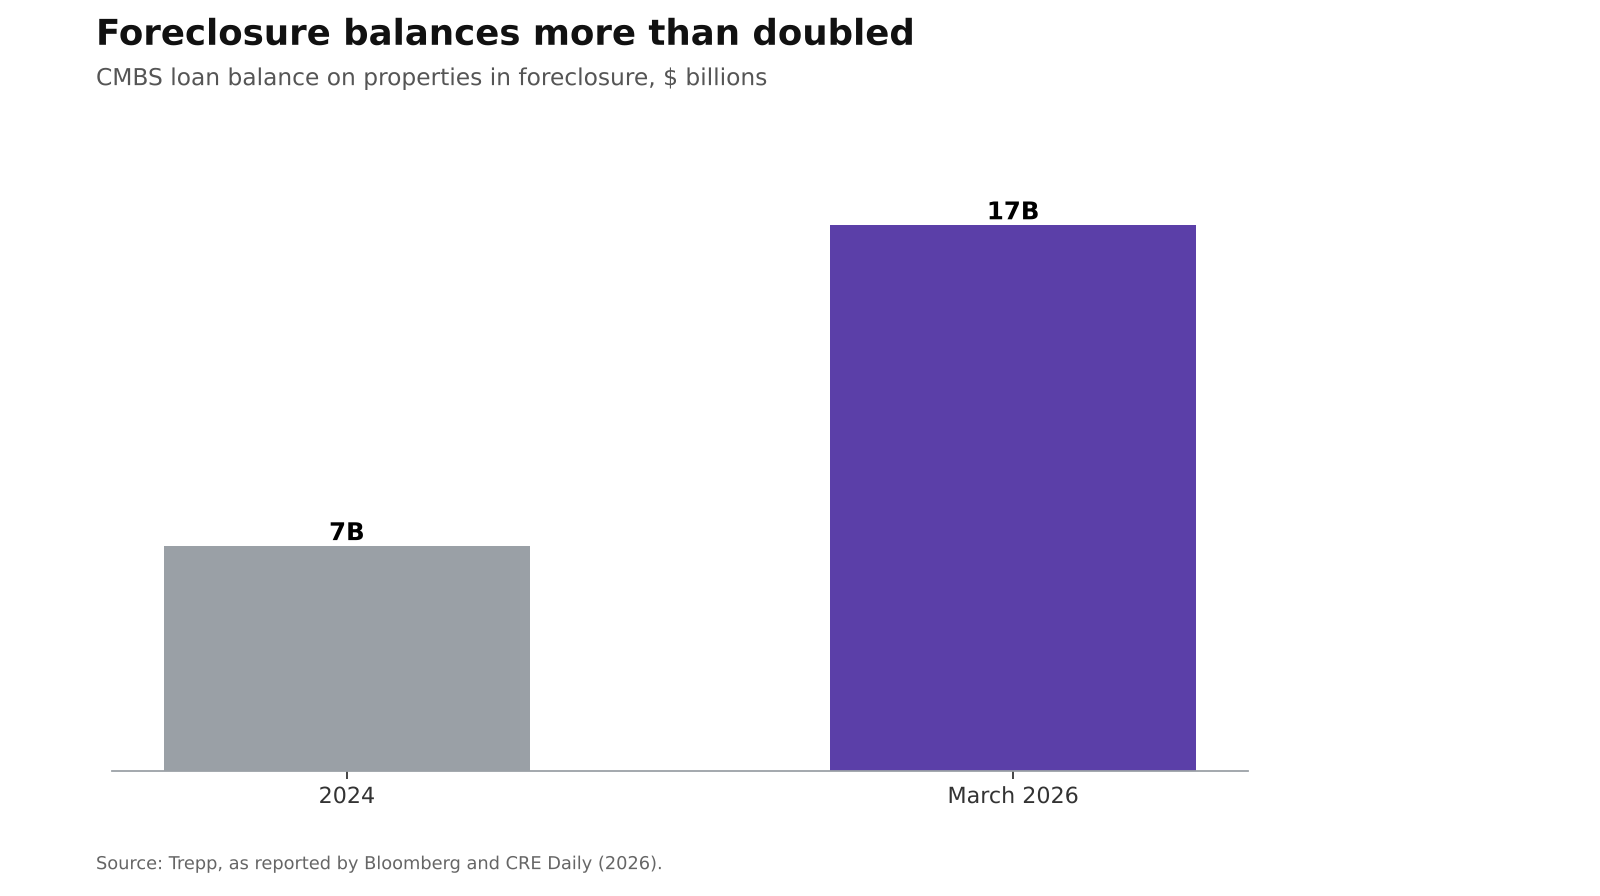
MSCI Real Assets estimated nearly $132 billion of distressed CRE debt in the first quarter, and for the first time since 2022, workouts outpaced new distress. Bloomberg documented lenders clearing loans at discounts of 30% to 85%. Trepp put CMBS loans on properties in foreclosure at $17 billion in March, up from $7 billion in 2024.
!Foreclosure balances more than doubled
The language changed too. One originator told Commercial Observer that lenders “are done with kicking the can.” Special servicing hit 11.49% in September, the highest since early 2013, and some of those loans were still making every payment. They just couldn’t get past their maturity date.
Why the loan becomes the exit
This isn’t a one-year problem. The MBA counts about $875 billion of commercial and multifamily mortgages maturing this year and $652 billion next year, with banks holding about $396 billion of 2026’s share. Much of it was borrowed when rates were 3% or 4%. The ten-year spent October near 5%.
A loan that can’t refinance has a handful of ways out. The lender can modify it, and modifications are getting shorter and stingier every quarter. The owner can sell the building, but nobody likes selling for less than they owe, so they hold out. Or the owner brings in rescue capital, if the building is good enough to justify it.
The lender can foreclose, which is slow, expensive and leaves a bank owning real estate it never wanted to run. Or the lender can sell the loan and hand all of that to someone built for it. That’s why the loan sale is the exit lenders are moving toward, even if banks are slow to take it.
The numbers point the same way. At the start of the year, CRED iQ counted about $40 billion of specially serviced CMBS loans with a defined workout plan. About 39% was headed for foreclosure, and about 19%, roughly $7.5 billion, for a note sale. Either way, control passes through the lender first. For scale, MSCI counted $13.2 billion of distressed property sales across the entire market in the first nine months of 2026, just 2.4% of deal volume.
And that’s CMBS alone. Those $396 billion of bank maturities, the largest share of any lender group, don’t show up in the CRED iQ count. That is the larger pool, and it sits outside the CMBS figures.
A different kind of owner
Buying a loan isn’t buying a building. You’re buying a legal position and a timeline. You need to know what the documents allow, how hard the borrower will fight, how long foreclosure takes in that state, and what the property is worth on the day it’s finally yours. A great real estate investor can lose money doing this. A good credit investor who understands buildings usually has the better odds.
The last cycle rewarded cheap leverage and a good broker relationship. This one rewards patience, legal stamina and capital that can go a year or two without a yield. The buyers best suited to it often come from outside the usual list: people who learned the business inside special servicers, credit managers moving into real estate, and family offices that prefer negotiated trades to auctions.
The bank on both sides of the trade
Here’s the part I keep coming back to. The bank selling the loan is often the same kind of institution financing the buyer.
FDIC data show bank loans to nonbank lenders up 22.4% in the year to June, against 4.1% for bank loans on commercial property. Not all of that is real estate, but the shape is clear enough. A bank sells a troubled loan, takes the loss once, then lends to a fund buying loans just like it, from a senior seat with a cushion underneath.
That is sound risk management. It also means the banks quietly set the price of this whole cleanup through the leverage they offer the buyers. A loan buyer with bank financing can pay more and close faster than one using only its own cash, so the well-financed buyers win the big trades. The smaller pools get less attention than they deserve, such as a regional bank’s pool of twenty loans with no broad marketing process.
A lot of those loans sit with community banks that still want close to par, backed by owners who won’t put new money in. The building can’t be fixed until someone buys it at a reset basis. We wrote about why that standoff is so hard to break in The Par Problem.
%%coda%%
In practice
Most of my conversations right now sit in four places. The first is loan sales out of smaller and mid-sized banks, where the pool of buyers is thinner than the supply. The second is recapitalizations: pref and mezz that let a good building with a bad capital structure avoid becoming a loan sale at all. The third is stretch senior, a single loan at higher leverage that replaces a senior-and-mezz stack for a borrower who needs more proceeds than a conventional lender will give. The last is the financing behind the loan buyers themselves, meaning who will lever an acquired loan, on what terms, and where that money isn’t there.
%%close%%
None of this is fixed. If the ten-year drifts back toward 4%, a lot of these loans may simply refinance. If regulators or accounting rules make long extensions attractive again, lenders may hold rather than sell. And if loan sales stay a small share of resolutions while special servicing keeps climbing, the handoff may be happening more slowly, or more quietly, than the data shows today.
We'll follow all of it through the Briefing and come back to this within a year.
Sources and methodology
- Sourcing note: we cite the organization that produced each figure. Where its own release isn’t publicly accessible, we name the outlet we read it in.
- Distress and workouts: MSCI Real Assets, Q1 2026 distress data, as reported by Bloomberg (2026). MSCI’s distress tracker is subscription-only.
- Loan-sale discounts: Bloomberg (2026). We read Bloomberg’s reporting through CRE Daily’s summary, “CRE Lenders Finally Cut Losses on Distressed Debt.”
- Foreclosure balances: Trepp, as reported by Bloomberg and CRE Daily (2026). Trepp’s underlying report is not public.
- Special servicing: Trepp September 2026 data, as published in CREFC’s Update on CMBS Loan Performance, September 2026.
- Workout strategies: CRED iQ, “Special Servicer Workout Strategies Shift Toward Resolution as Foreclosures Surge” (Jan 16, 2026). Of $40.1B of specially serviced CMBS loans with defined workout strategies, 39.1% were foreclosure and 18.7% note sale. These are planned strategies, not closed transactions, and cover CMBS only. Note sales alone were about $7.5B.
- Distressed property sales: MSCI, January–September 2026, as reported by Bisnow and The Real Deal (Oct 21, 2026). MSCI’s report is subscription-only. The comparison is directional: one figure is a CMBS workout pipeline, the other is closed sales across all lenders.
- Lender quote: Commercial Observer (Sept 2026), quoting NewPoint Real Estate Capital’s Ryan Koehler.
- Maturities: Mortgage Bankers Association, 2025 Commercial Real Estate Survey of Loan Maturity Volumes, press release Feb 9, 2026.
- $875B matures in 2026 and $652B in 2027; depositories hold $396B of the 2026 total.
- Other estimates differ by method. S&P Global’s loan-level series is higher.
- Community bank and owner behavior: VCG first-hand observation. No institutions or borrowers are named. The full argument is in The Par Problem.
- Bank lending: FDIC, Quarterly Banking Profile, Q2 2026. Loans to nonbank lenders rose 22.4% and nonfarm nonresidential loans rose 4.1%. The nonbank category includes non-CRE borrowers.
- Where we’re spending our attention: VCG’s areas of interest, not an offer of any investment or service.