VCG INSIGHTS · NOTES · NO. 1
By Bhavik Khatri, Founder & Managing Principal
The Par Problem
The gap between what banks want for troubled loans and what buyers will pay closes when holding gets more expensive than selling.
The gap between what banks want for their troubled real estate loans and what buyers will pay won’t close because buyers get generous. It closes when holding the loan gets more expensive than selling it.
Right now, holding is still cheaper.
Talk to banks and you hear two things in the same breath: yes, there are problems, and yes, they’d like to get back close to par. Lenders that actually sold this year took discounts of 30% to 85%.
Part of the reason is how the loss shows up. A bank carries a loan at its balance less whatever it has reserved. Sell at 70 cents and it books the gap between that price and the net carrying value, all at once. Hold, and the loss stays an estimate.
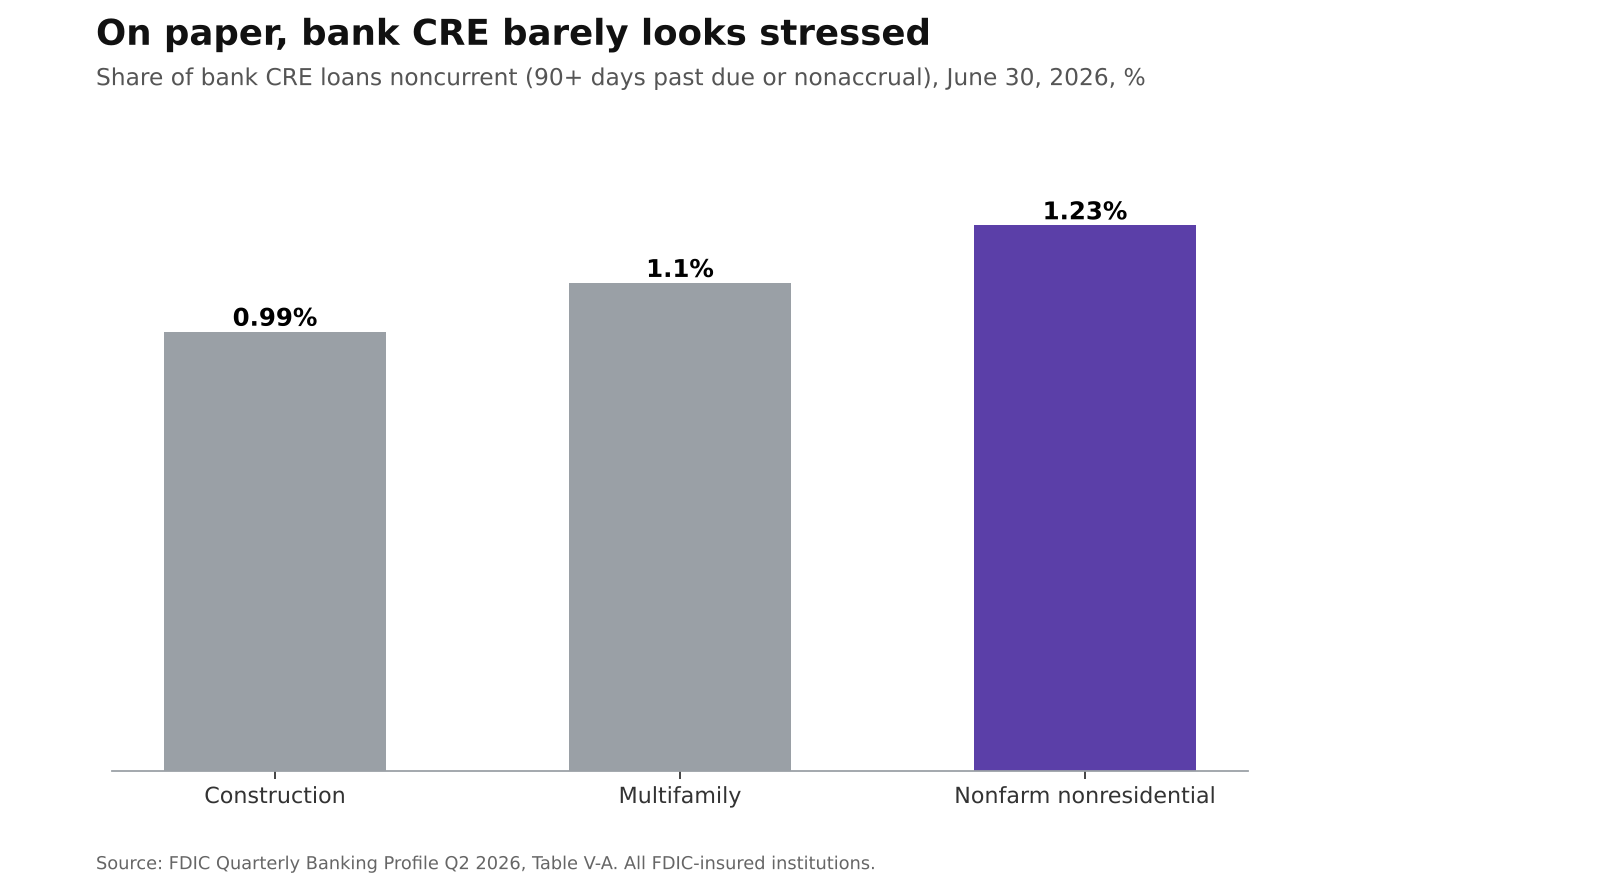
On paper, these loans look fine, so not much is reserved against them. At midyear only about 1.2% of banks’ nonfarm nonresidential loans and 1.1% of multifamily loans were noncurrent, and industry reserves covered noncurrent loans 1.7 times over. But reserves follow delinquency and loss models, not today’s bid. A current loan on a building now worth less than its balance can carry very little reserve, and a sale at 70 makes that loss real overnight.
!On paper, bank CRE barely looks stressed
The owner isn’t moving either. When the equity is that far under water, nobody puts good money in to rescue it. What the asset needs is a new basis, and more time won’t provide one. Many community banks are built on relationships rather than workouts, and they carry more CRE relative to their capital than the big banks do. They aren’t set up to force that reset.
What changes the math is a regulator’s harder question, a maturity that can’t be extended again, or capital the bank needs elsewhere. When the gap does close, it tends to close in batches. Quarter-ends and exam cycles push decisions into the same windows, and once one bank prints a sale, that price becomes the mark its peers’ examiners point to.
Next read: the FDIC’s third-quarter numbers in late November. Rising CRE noncurrent rates would mean more of these losses are moving from current to visible.
Sources and methodology
- Sourcing note: we cite the organization that produced each figure. Where its own release isn’t publicly accessible, we name the outlet we read it in.
- Noncurrent rates and reserve coverage: FDIC, Quarterly Banking Profile, Q2 2026, Table V-A and narrative (June 30, 2026, all insured institutions).
- Noncurrent rates: nonfarm nonresidential 1.23%, multifamily 1.10%, construction and development 0.99%.
- Reserve coverage of noncurrent loans: 172.7%, all loans.
- The FDIC also notes that provisions roughly equaled net charge-offs in Q2, so reserves are being replenished, not built ahead.
- CRE concentration: FDIC, same report. Large banks have lower concentrations of non-owner-occupied CRE relative to assets and capital than smaller banks.
- Loan-sale discounts: Bloomberg (2026), as summarized by CRE Daily.
- Bank pricing expectations, workout capacity and owner behavior: VCG first-hand observations from conversations. No institutions or borrowers are named, and no mandates are implied.
- Accounting: a general description. Treatment varies by bank and by whether a loan is held for investment or held for sale.